efficiency_vs_x#
- esis.flights.f1.optics.gratings.efficiencies.efficiency_vs_x()[source]#
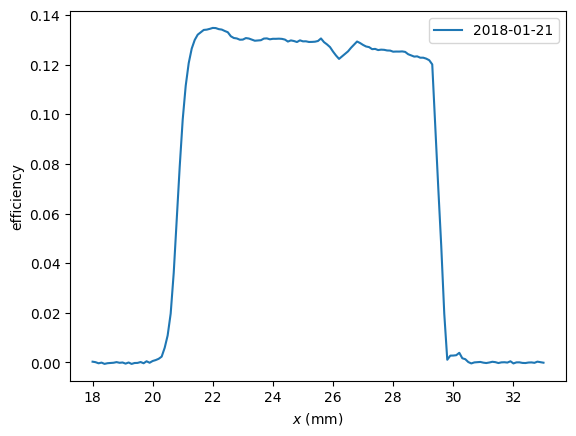
Load the measured efficiency as a function of position, \(x\).
This includes contributions from both the coatings and grooves and was measured by Eric Gullikson.
Examples
Plot the efficiency vs \(x\) position measurements using matplotlib.
import matplotlib.pyplot as plt
import astropy.visualization
import named_arrays as na
from esis.flights.f1.optics import gratings

# Load the efficiency measurements
efficiency = gratings.efficiencies.efficiency_vs_x()

# Plot the measurements using matplotlib
with astropy.visualization.quantity_support():
    fig, ax = plt.subplots()
    na.plt.plot(
        efficiency.inputs.position,
        efficiency.outputs,
        ax=ax,
        label=efficiency.inputs.time.strftime("%Y-%m-%d"),
    );
    ax.set_xlabel(f"$x$ ({ax.get_xlabel()})");
    ax.set_ylabel(f"efficiency");
    ax.legend();
- Return type:
FunctionArray[TemporalSpectralPositionalVectorArray, ScalarArray]