Level_1#
- class esis.data.Level_1(inputs=0, outputs=0, instrument=None, *, axis_time='time', axis_channel='channel', axis_x='detector_x', axis_y='detector_y')[source]#
Bases:
AbstractChannelDataESIS images represented in terms of photoelectrons collected by the sensor.
This class is intended to be created from an instance of
Level_0using the :meth:from_level_0` method.Attributes
A
tupleofstrrepresenting the names of each dimension ofndarray.Return keys corresponding to all input axes representing bin centers
Return keys corresponding to all input axes representing bin vertices
The name of the logical axis corresponding to the different channels.
The name of the logical axis corresponding to changing time.
The name of the horizontal axis of the sensor.
The name of the vertical axis of the sensor.
if this array has multiple components, broadcast them against each other.
The name of each ESIS channel in a human-readable format.
Converts this array to an instance of
named_arrays.AbstractExplicitArrayA model of the optical system associated with these images.
L2-norm of this array.
Number of dimensions of the array.
The number of pixels along the horizontal axis.
The number of pixels along the vertical axis.
Shape of the array.
Total number of elements in the array.
The
AbstractArraytype corresponding to this arrayThe
AbstractExplicitArraytype corresponding to this arrayReturns a new array with its units removed, if they exist
Methods
__init__([inputs, outputs, instrument, ...])add_axes(axes)Add new singleton axes to this array
all([axis, where])animate([ax, cmap, norm, vmin, vmax, ...])Create an animation using the frames in this dataset.
any([axis, where])astype(dtype[, order, casting, subok, copy])Copy of the array cast to a specific data type.
broadcast_to(shape[, append])cell_centers([axis, random])Convert an array from cell vertices to cell centers.
combine_axes([axes, axis_new])Combine some of the axes of the array into a single new axis.
copy()from_level_0(a[, instrument])Create a new instance of this class from an instance of
Level_0.from_scalar_array(a[, like])Constructs a new version of this array using
aas the underlying data.index(value[, axis])index_secant(value[, axis])interp_linear(item)max([axis, initial, where])mean([axis, where])median([axis])min([axis, initial, where])ndindex([axis_ignored])pcolormesh(axs, input_component_x, ...[, ...])Plot a
FunctionArrayviamatplotlib.pyplot.pcolormesh().percentile(q[, axis, out, overwrite_input, ...])ptp([axis])regrid(inputs[, axis, method, weights])Resample this function array onto a new set of input coordinates using
named_arrays.regridding.regrid().replace(**changes)A method version of
dataclasses.replace()for named arrays.reshape(shape)rms([axis, where])std([axis, where])sum([axis, where])to(unit[, equivalencies, copy])Convert this array to a new unit.
to_jshtml([ax, cmap, norm, vmin, vmax, ...])Create a Javascript animation ready to be displayed in a Jupyter notebook.
to_string([prefix, multiline])Convert this array instance to a string representation.
to_string_array([format_value, format_unit, ...])Convert to an array of strings where each string has an appropriately-formatted unit attached to the value.
transpose([axes])var([axis, where])vmr([axis, where])volume_cell(axis)Computes the n-dimensional volume of each cell formed by interpreting this array as a logically-rectangular grid of vertices.
weights(inputs[, axis, method])Compute the resampling weights of this array using
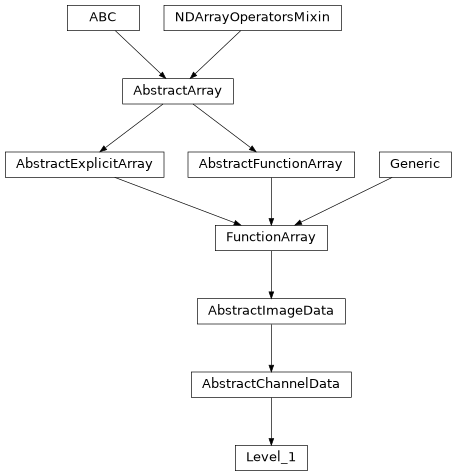
named_arrays.regridding.weights().Inheritance Diagram
- Parameters:
inputs (InputsT)
outputs (OutputsT)
instrument (None | Instrument)
axis_time (str)
axis_channel (str)
axis_x (str)
axis_y (str)
- add_axes(axes)#
Add new singleton axes to this array
- all(axis=None, where=<no value>)#
- animate(ax=None, cmap=None, norm=None, vmin=None, vmax=None, cbar_fraction=0.1)#
Create an animation using the frames in this dataset.
- Parameters:
ax (None | Axes | AbstractArray) – The
Axesinstance(s) to use. IfNone, a new set of axes will be created.cmap (None | str | Colormap) – The colormap used to map scalar data to colors.
norm (None | str | Normalize) – The normalization method used to scale data into the range [0, 1] before mapping to colors.
vmin (None | int | float | complex | ndarray | Quantity | AbstractArray) – The minimum value of the data range. If norm is
None, this parameter will be ignored.vmax (None | int | float | complex | ndarray | Quantity | AbstractArray) – The maximum value of the data range. If norm is
None, this parameter will be ignored.cbar_fraction (float) – The fraction of the space to use for the colorbar axes.
- Return type:
- any(axis=None, where=<no value>)#
- astype(dtype, order='K', casting='unsafe', subok=True, copy=True)#
Copy of the array cast to a specific data type.
Equivalent to
numpy.ndarray.astype().
- broadcast_to(shape, append=False)#
- cell_centers(axis=None, random=False)#
Convert an array from cell vertices to cell centers.
- Parameters:
- Return type:
- combine_axes(axes=None, axis_new=None)#
Combine some of the axes of the array into a single new axis.
- classmethod from_level_0(a, instrument=None)[source]#
Create a new instance of this class from an instance of
Level_0.This function applies the following operations to the
Level_0data:Removes the bias (or pedestal) using
unbiased().Removes the non-active pixels using
active().Converts the signal to electrons using
electrons().Removes the dark signal using
dark_subtracted.Removes the cosmic ray spikes using
despiked().
- Parameters:
instrument (None | Instrument) – A model of the ESIS instrument to associate with these observations.
- Return type:
- classmethod from_scalar_array(a, like=None)#
Constructs a new version of this array using
aas the underlying data.- Parameters:
a (float | Quantity | AbstractScalarArray) – Anything that can be coerced into an instance of
named_arrays.AbstractScalarArray.like (None | Self) – Optional reference object. If provided, the result will be defined by this object.
- Return type:
- index(value, axis=None)#
- index_secant(value, axis=None)#
- interp_linear(item)#
- Parameters:
item (dict[str, AbstractArray])
- Return type:
- max(axis=None, initial=<no value>, where=<no value>)#
- mean(axis=None, where=<no value>)#
- min(axis=None, initial=<no value>, where=<no value>)#
- ndindex(axis_ignored=None)#
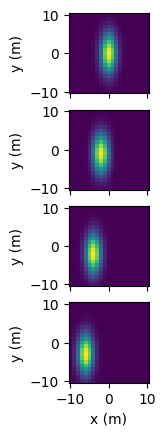
- pcolormesh(axs, input_component_x, input_component_y, input_component_row=None, input_component_column=None, index=None, output_component_color=None, **kwargs)#
Plot a
FunctionArrayviamatplotlib.pyplot.pcolormesh().FunctionArray.pcolormesh()takes in an axes object, or array of axes objects, along with components to be plotted along the x and y plot axes (input_component_xandinput_component_y). Additional components can be tiled along subplot row/column and are specified ininput_component_rowandinput_component_column.import named_arrays as na import numpy as np import astropy.units as u import matplotlib.pyplot as plt position = na.Cartesian2dVectorLinearSpace( start=-10, stop=10, axis=na.Cartesian2dVectorArray( x='position_x', y='position_y', ), num=21, ) * u.m x_width = 5 * u.m y_width = 2 * u.m velocity = 1 * u.m/u.s time = na.ScalarLinearSpace( start=0 * u.s, stop=3 * u.s, num=4, axis='time' ) intensity = np.exp(-(((position.x + velocity*time)/x_width) ** 2 + ((position.y + 2*velocity*time)/y_width)** 2)) scene = na.FunctionArray( inputs=position, outputs=intensity, ) fig, axs = plt.subplots( nrows=scene.outputs.shape['time'], squeeze=False, sharex=True, subplot_kw=dict(aspect='equal'), ) scene.pcolormesh( axs=axs, input_component_x='x', input_component_y='y', input_component_row='time', )
- percentile(q, axis=None, out=None, overwrite_input=False, method='linear', keepdims=False)#
- regrid(inputs, axis=None, method='multilinear', weights=None)#
Resample this function array onto a new set of input coordinates using
named_arrays.regridding.regrid().- Parameters:
inputs (AbstractArray) – The new input coordinates on which to resample the outputs.
axis (None | str | tuple[str]) – The logical axes of the input over which to resample.
method (Literal['multilinear', 'conservative']) – The resampling method to use.
weights (None | tuple[AbstractScalar, dict[str, int], dict[str, int]]) – Optional weights which can be computed in advance using
weights()to greatly speed repeated resampling of the same inputs.
- Return type:
See also
weights()If you need to resample the same coordinates more than once.
- replace(**changes)#
A method version of
dataclasses.replace()for named arrays.- Parameters:
changes – The fields of the dataclass to be overwritten
- Return type:
- rms(axis=None, where=<no value>)#
- std(axis=None, where=<no value>)#
- sum(axis=None, where=<no value>)#
- to(unit, equivalencies=[], copy=True)#
Convert this array to a new unit.
Equivalent to
astropy.units.Quantity.to().
- to_jshtml(ax=None, cmap=None, norm=None, vmin=None, vmax=None, cbar_fraction=0.1, fps=None)#
Create a Javascript animation ready to be displayed in a Jupyter notebook.
Converts the output of
animate()to Javascript usingmatplotlib.animation.Animation.to_jshtml(), and then wraps the html string inIPython.display.HTML.- Parameters:
ax (None | Axes | AbstractArray) – The
Axesinstance(s) to use. IfNone, a new set of axes will be created.cmap (None | str | Colormap) – The colormap used to map scalar data to colors.
norm (None | str | Normalize) – The normalization method used to scale data into the range [0, 1] before mapping to colors.
vmin (None | int | float | complex | ndarray | Quantity | AbstractArray) – The minimum value of the data range. If norm is
None, this parameter will be ignored.vmax (None | int | float | complex | ndarray | Quantity | AbstractArray) – The maximum value of the data range. If norm is
None, this parameter will be ignored.cbar_fraction (float) – The fraction of the space to use for the colorbar axes.
fps (None | float) – The frames per second of the animation.
- Return type:
- to_string(prefix=None, multiline=None)#
Convert this array instance to a string representation.
- to_string_array(format_value='%.2f', format_unit='latex_inline', pad_unit='$\\,$')#
Convert to an array of strings where each string has an appropriately-formatted unit attached to the value.
- var(axis=None, where=<no value>)#
- volume_cell(axis)#
Computes the n-dimensional volume of each cell formed by interpreting this array as a logically-rectangular grid of vertices.
Note that this method is usually only used for sorted arrays.
If self is a scalar, this method computes the length of each edge, and is equivalent to
numpy.diff(). If self is a 2d vector, this method computes the area of each quadrilateral, and if self is a 3d vector, this method computes the volume of each cuboid.
- weights(inputs, axis=None, method='multilinear')#
Compute the resampling weights of this array using
named_arrays.regridding.weights(). The output of this method is designed to be used byregrid().- Parameters:
inputs (AbstractArray) – The new input coordinates on which to resample the outputs.
axis (None | str | tuple[str]) – The logical axes of the input over which to resample.
method (Literal['multilinear', 'conservative']) – The resampling method to use.
- Return type:
See also
regrid()A method designed to use these weights.
- property axes: tuple[str, ...]#
A
tupleofstrrepresenting the names of each dimension ofndarray.Must have the same length as the number of dimensions of
ndarray.
- property axes_center: tuple(str)#
Return keys corresponding to all input axes representing bin centers
- property axes_flattened: str#
Combine
axesinto a singlestr.This is useful for functions like
numpy.flatten()which returns an array with only one dimension.
- property axes_vertex: tuple(str)#
Return keys corresponding to all input axes representing bin vertices
- axis_channel: str = 'channel'#
The name of the logical axis corresponding to the different channels.
- property broadcasted: FunctionArray#
if this array has multiple components, broadcast them against each other.
Equivalent to
a.broadcast_to(a.shape)
- property channel: ScalarArray[ndarray[Any, dtype[str]]]#
The name of each ESIS channel in a human-readable format.
- property explicit: FunctionArray#
Converts this array to an instance of
named_arrays.AbstractExplicitArray
- property indices: dict[str, ScalarArrayRange]#
- inputs: InputsT = 0#
- instrument: None | Instrument = None#
A model of the optical system associated with these images.
- property length: FunctionArray#
L2-norm of this array.
- property ndim: int#
Number of dimensions of the array. Equivalent to
numpy.ndarray.ndim.
- outputs: OutputsT = 0#
- property shape: dict[str, int]#
Shape of the array. Analogous to
numpy.ndarray.shapebut represented as adictwhere the keys are the axis names and the values are the axis sizes.
- property size: int#
Total number of elements in the array. Equivalent to
numpy.ndarray.size
- property type_abstract: Type[AbstractFunctionArray]#
The
AbstractArraytype corresponding to this array
- property type_explicit: Type[FunctionArray]#
The
AbstractExplicitArraytype corresponding to this array
- property value: FunctionArray#
Returns a new array with its units removed, if they exist