

distortion_fit#
- esis.flights.f1.optics.distortion_fit(grid=None, axis_channel='channel', num_distribution=11)[source]#
Apply the best-fit distortion parameters to the ESIS-I
design().The parameters are hard-coded from the best distortion fit of the ESIS-I flight data, optimized against the
time=15frame of the 2019-09-30 flight (esis.flights.f1.data.level_1(), with a start time of 2019-09-30T18:08:41.642 UTC). The values are per-channel and were produced by theESISI_distortion_optimization_20260213_151715run.- Parameters:
grid (None | ObjectVectorArray) – sampling of wavelength, field, and pupil positions that will be used to characterize the optical system.
axis_channel (str) – The name of the logical axis corresponding to changing camera channel.
num_distribution (int) – number of Monte Carlo samples to draw when computing uncertainties
- Return type:
Examples
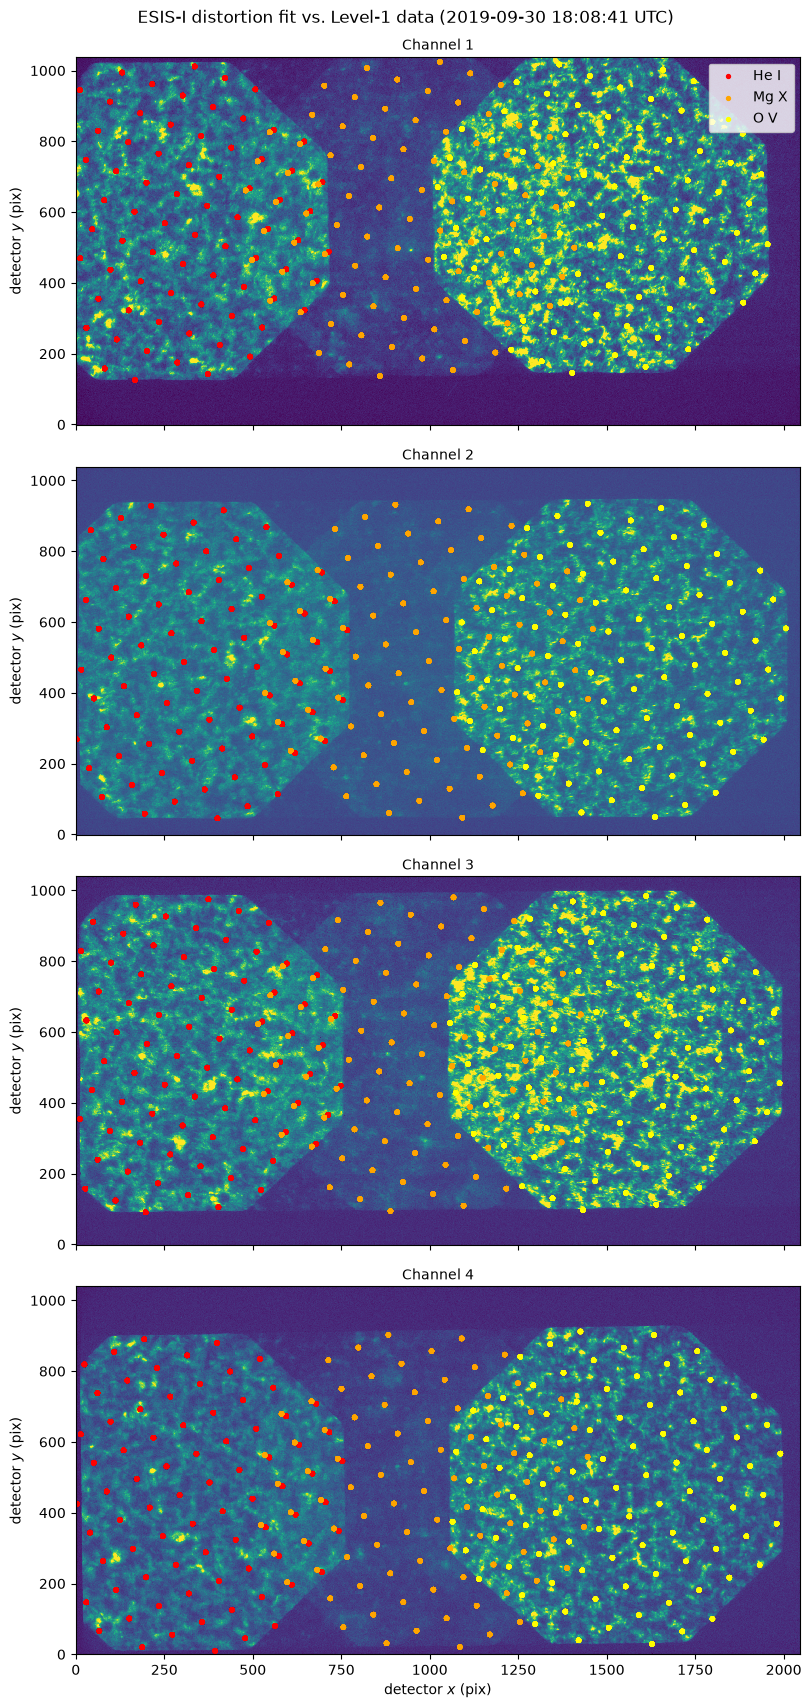
Overplot the ray-traced detector footprint of each spectral line onto the Level-1 frame that the distortion fit was optimized against. Each line’s footprint should land on its corresponding image of the field stop.
import numpy as np
import astropy.units as u
import named_arrays as na
import esis

l1 = esis.flights.f1.data.level_1()[dict(time=15)]
model = esis.flights.f1.optics.distortion_fit(num_distribution=0)

rays = model.system.rayfunction_default.outputs
position = rays.position.to(u.um).mean(axis=("pupil_x", "pupil_y"))
position = position / model.camera.sensor.width_pixel * u.pixel

fig, ax = na.plt.subplots(
    figsize=(8, 17),
    constrained_layout=True,
    axis_rows="channel",
    nrows=l1.shape["channel"],
    sharex=True,
    origin="upper",
)
fig.suptitle(
    "ESIS-I distortion fit vs. Level-1 data"
    " (2019-09-30 18:08:41 UTC)"
)
na.plt.set_xlabel("detector $x$ (pix)", ax=ax[dict(channel=~0)])
na.plt.set_ylabel("detector $y$ (pix)", ax=ax)
na.plt.set_aspect("equal", ax=ax)
na.plt.pcolormesh(
    l1.inputs.pixel.x,
    l1.inputs.pixel.y,
    C=l1.outputs.value,
    ax=ax,
    vmax=np.percentile(l1.outputs.value, 99),
)
na.plt.text(
    x=0.5,
    y=1.01,
    s=l1.channel,
    transform=na.plt.transAxes(ax),
    ax=ax,
    ha="center",
    va="bottom",
)
spectral_lines = ["He I", "Mg X", "O V"]
colors = ["red", "orange", "yellow"]
for i in range(len(spectral_lines)):
    j = dict(wavelength=i)
    na.plt.scatter(
        position.x[j] + 1024 * u.pixel,
        position.y[j] + 512 * u.pixel,
        color=colors[i],
        ax=ax,
        s=8,
        where=rays.unvignetted[j],
        label=spectral_lines[i],
    )
ax.ndarray[0].legend(loc="upper right");
References to
esis.flights.f1.optics.distortion_fit