Point-Spread Function#
This report computes the point-spread function of the ESIS optical system.
[1]:
import matplotlib.pyplot as plt
import astropy.visualization
import astropy.units as u
import named_arrays as na
import esis
Start by loading the proposed optical design
[2]:
instrument = esis.flights.f1.optics.design_single(num_distribution=0)
instrument.field.num = 5
# spectrograph.pupil.num = 21
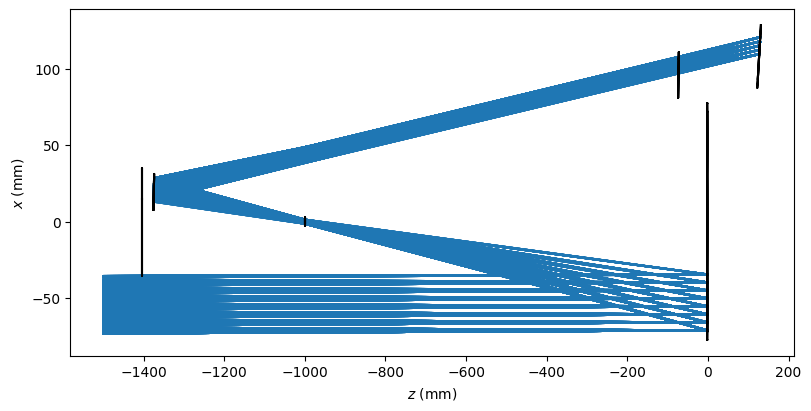
Plot a schematic of the spectrograph design
[3]:
with astropy.visualization.quantity_support():
    fig, ax = plt.subplots(
        figsize=(8, 4),
        constrained_layout=True,
    )
    instrument.system.plot(
        ax=ax,
        # plot_rays=False,
        components=("z", "x"),
        color="black",
        # plot_rays_vignetted=True,
        kwargs_rays=dict(
            color="tab:blue",
            zorder=0,
        ),
    )
    ax.set_xlabel(f"$z$ ({ax.get_xlabel()})")
    ax.set_ylabel(f"$x$ ({ax.get_ylabel()})")
    # ax.set_aspect("equal")
WARNING: function 'sqrt' is not known to astropy's Quantity. Will run it anyway, hoping it will treat ndarray subclasses correctly. Please raise an issue at https://github.com/astropy/astropy/issues. [astropy.units.quantity]
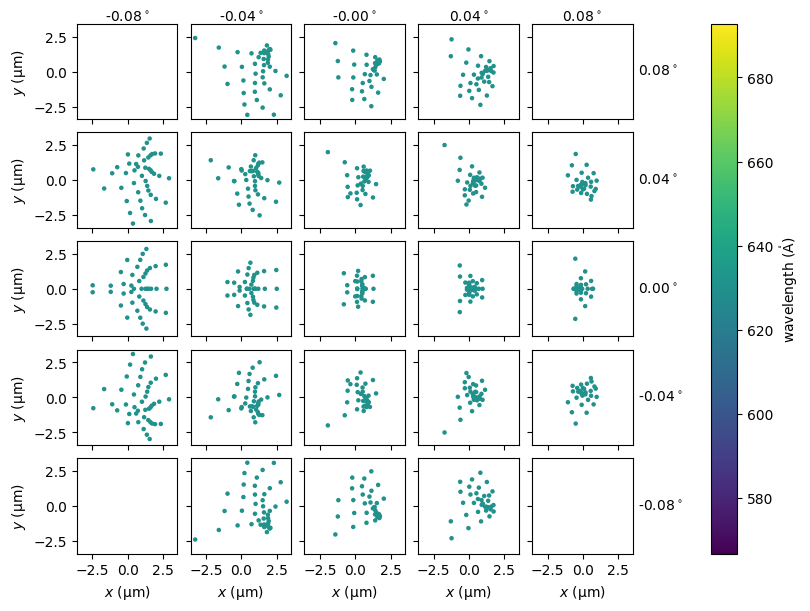
Plot a spot diagram for the nominal wavelength
[4]:
fig, ax = instrument.system.spot_diagram()